Hiring numbers that update as work happens — not at month end.
Executives get company-wide KPIs. TA heads see recruiter workload and how many candidates are moving and where they are stuck. Recruiters see their own queue. All from dashboards anyone can open, with an AI chat assistant for questions that don't fit filters.
Live dashboards. No data team required. Product screenshot
Captured Jun 16, 2026
Source: local seeded analytics dashboard recapture
Product screenshot
Captured Jun 16, 2026
Source: local seeded analytics dashboard recapture
Live KPIs, not exports
Active jobs, total candidates, hiring funnel, applications trend, and jobs-by-status update as work happens. No export-to-Excel step between the pipeline and the number.
Filterable by practice, recruiter, and date
Every dashboard view filters by practice group, job function, individual recruiter, and date range — so each role sees what's relevant to their decisions.
AI Analytics Chat
Ask in plain English — "How many L2 rejections in April?" — and get an answer with the pipeline evidence used. No dashboard navigation required.
Feedback intelligence, saved and searchable
Every submitted interview scorecard is saved and searchable. Patterns across hundreds of rounds surface in seconds, with citations from the original feedback sessions.
Role-appropriate depth
Executives see company-wide totals. TA heads see team and recruiter workload. Recruiters see their own pipeline and queue — each role sees the view that is relevant to their decisions.
Where candidates came from, how many are moving, and how load is spread — from one screen.
The jobs analytics dashboard gives TA heads and recruiters a filterable view of what is moving through the pipeline, where candidates are stuck, and how work is distributed across the team.
Replaces monthly status-update meetings with a shared dashboard anyone can open between those meetings.
- Requisition health — total, active, filled, and average time-to-fill from the same dashboard
- Status donut — jobs by status so TA heads can see draft, open, hiring, shortlisted, and closed proportions at a glance
- Location bar chart — job demand by geography for distributed hiring teams
- Export-ready views — spreadsheet and PDF actions for leadership review packets
- Date range filter — select any window to narrow the view to the period under review
View full size
Captured Jun 16, 2026
Source: local seeded analytics dashboard recapture
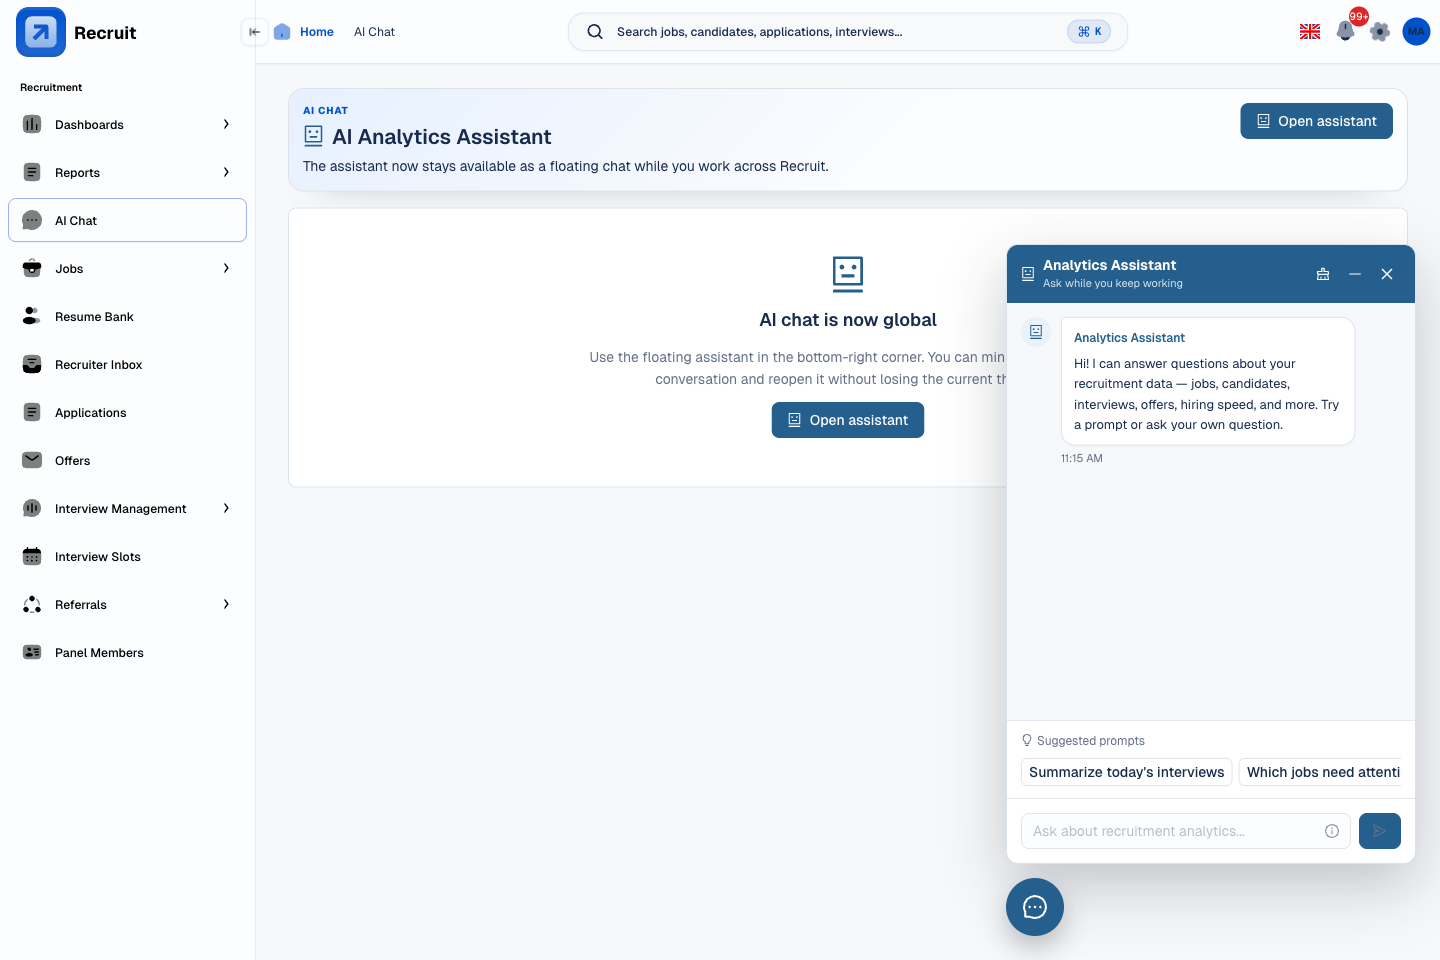
Questions that don't fit dropdowns.
Some questions can't be answered by navigating to a filter. "Why are L1 rejections climbing in Cloud?" "Which roles are taking the longest to fill?" The Analytics Chat widget follows you around the app and answers in the same tab as the work you were doing.
Replaces flagging a question in a standup with getting an answer now, in the same screen, with the evidence cited.
- On every page — draggable floating assistant available across the app, not only on the analytics screen
- Questions you type in your own words — ask in plain English; the system maps the question to pipeline data
- Evidence shown — answers include the data the AI used, so the answer is auditable, not trusted blindly
- Ready-made question buttons — common questions are surfaced as buttons so recruiters know what to ask
 View full size
Captured Jun 16, 2026
Source: local seeded floating analytics chat capture
View full size
Captured Jun 16, 2026
Source: local seeded floating analytics chat capture
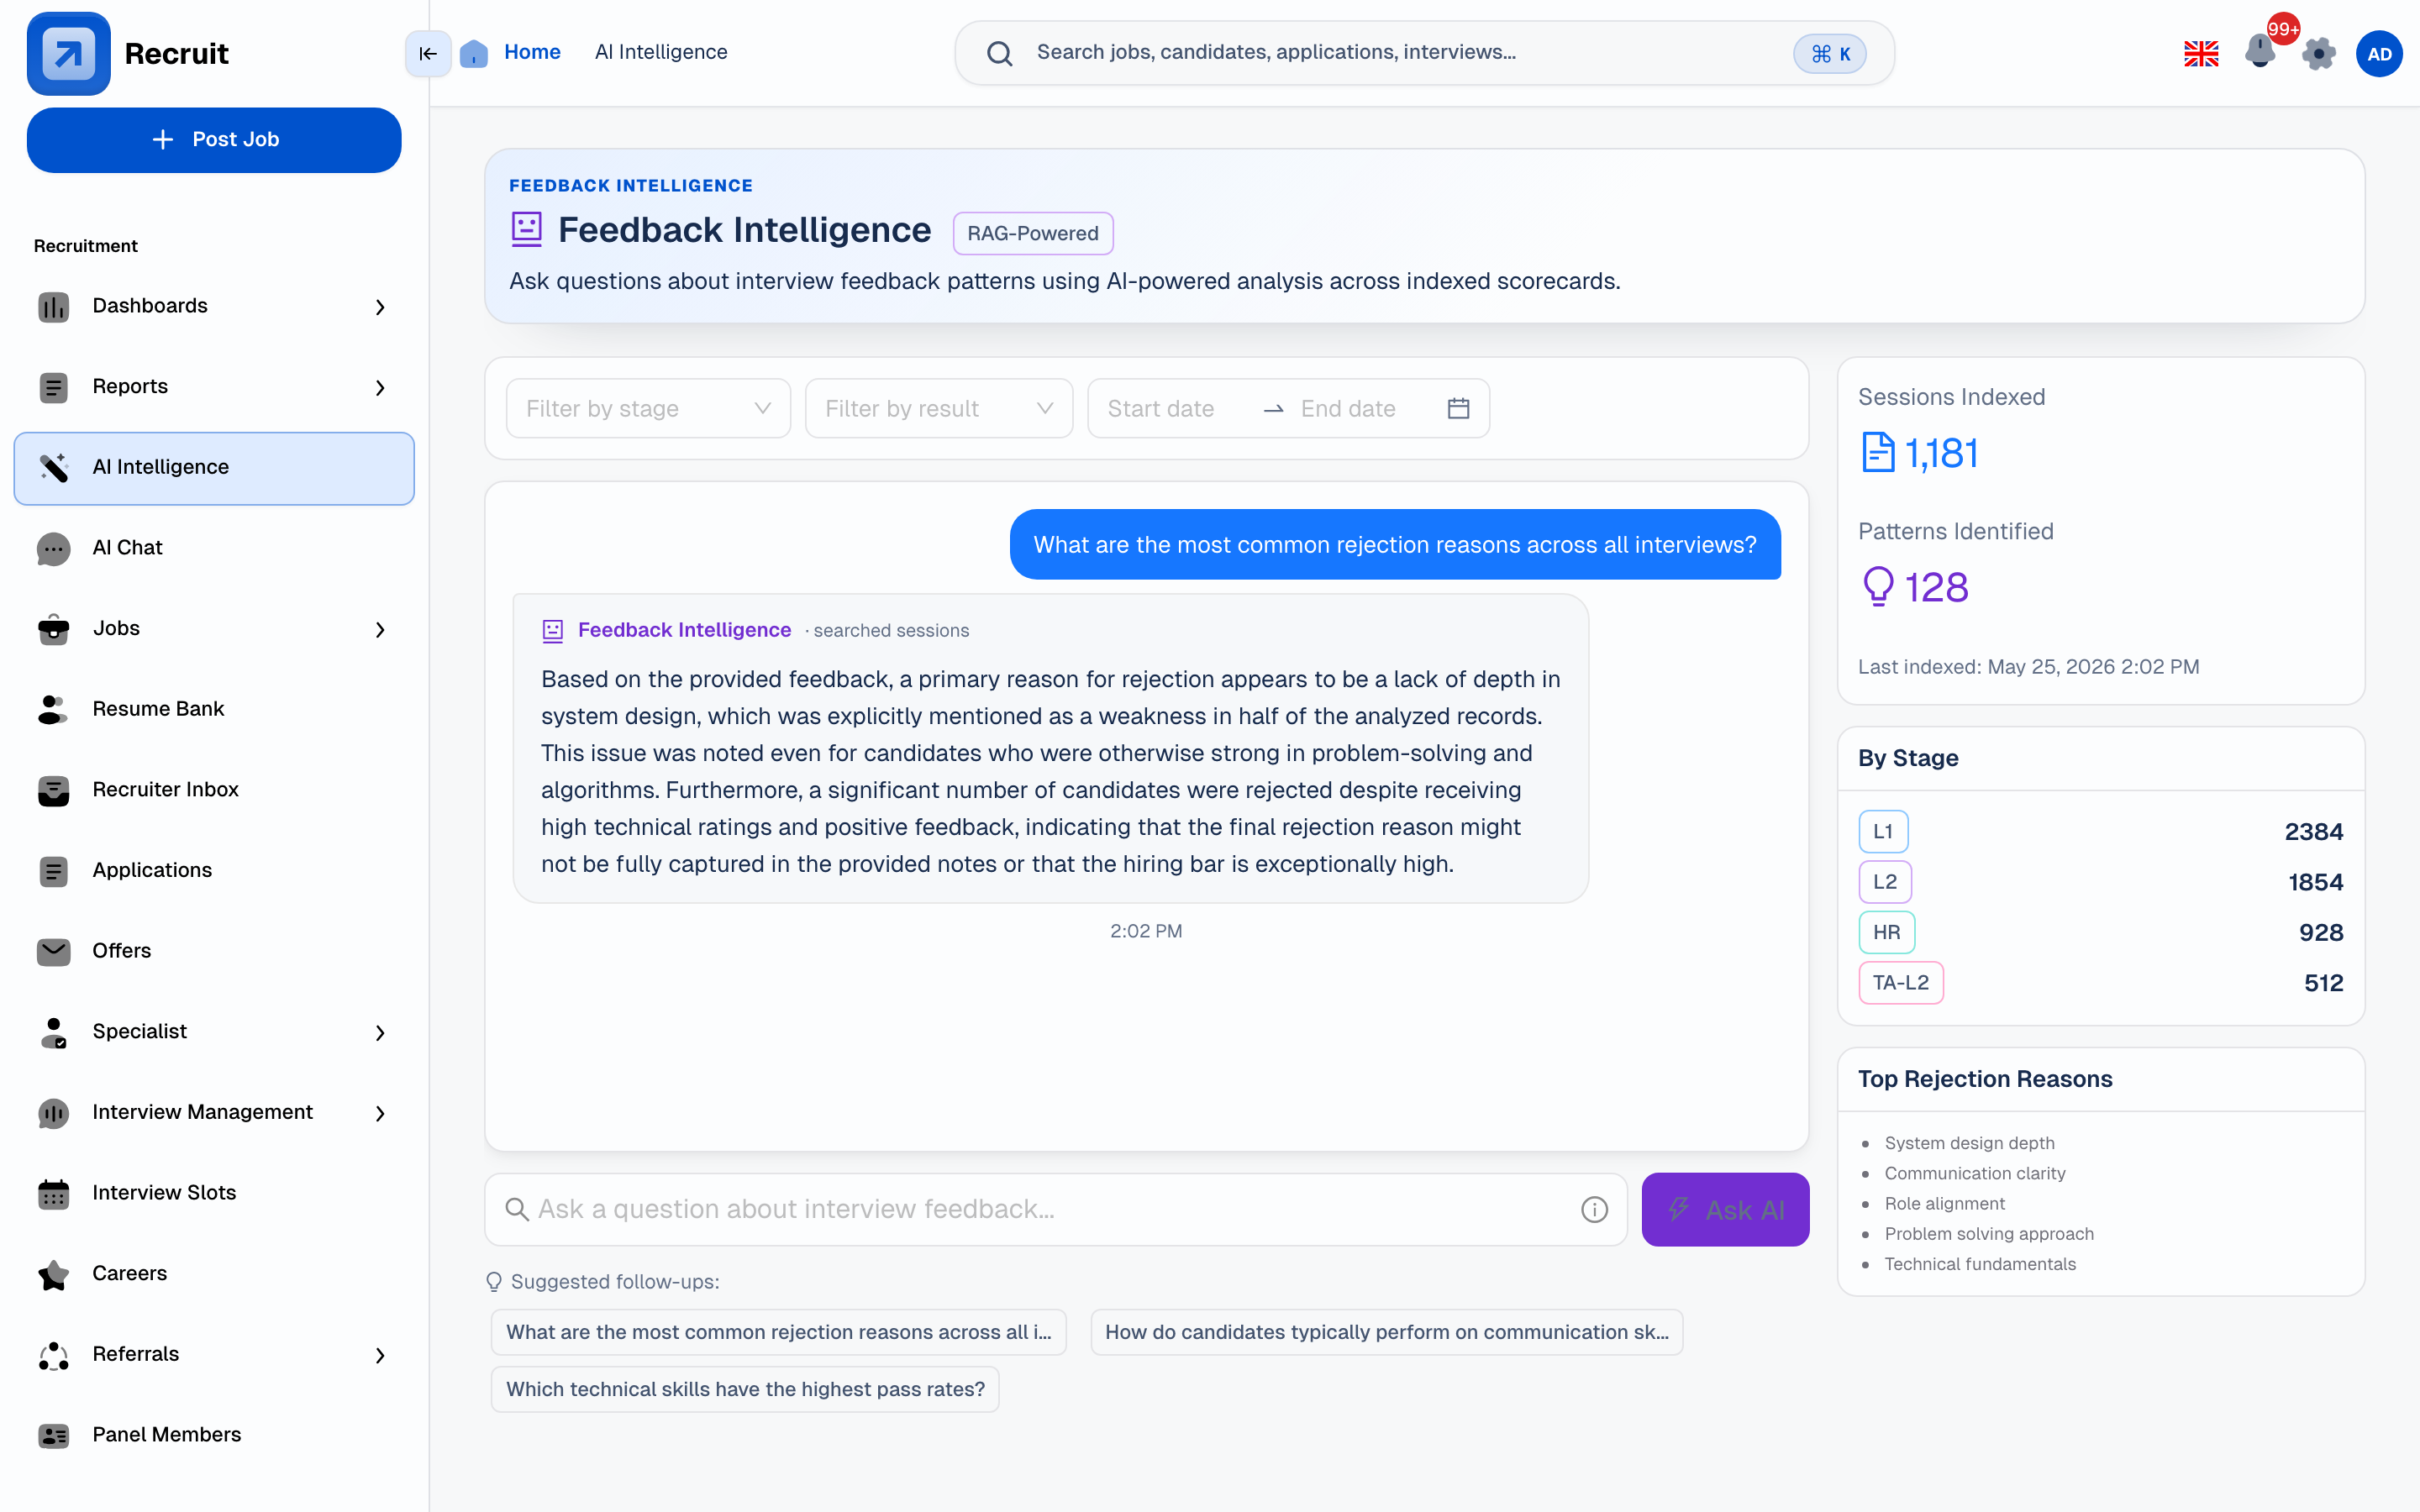
Patterns from every interview round you've run — saved and searchable.
Feedback Intelligence saves every submitted scorecard. Ask a question, get an answer with the sessions it read. Answers appear as the system reads through the records, so there's no wait for a full report.
- Searchable feedback history — all submitted scorecards available for query, not just the most recent cycle
- Stage breakdown — which stages produce the highest rejection volume, and why
- Rejection signal analysis — patterns in why candidates were declined surface without manual spreadsheet analysis
- Citations on every answer — the specific sessions the AI read are linked, so the answer can be verified
 View full size
Captured Jun 16, 2026
Source: Local feedback intelligence capture
View full size
Captured Jun 16, 2026
Source: Local feedback intelligence capture
Analytics anyone on the team can read — without a data team to produce them.
Recruit's analytics are built into the hiring workflow — not a separate reporting tool that needs a dashboard-building team to maintain.
Live from the pipeline
Every KPI tile, chart, and filter reads from the same data recruiters are entering as they work — no scheduled exports, no overnight sync.
Each role sees what matters to them
Executive, TA head, AM, Practice Head, and recruiter dashboards each show the view that is relevant to their decisions — from company-wide totals to individual pipeline.
AI answers cite their sources
Analytics Chat and Feedback Intelligence show which pipeline records or feedback sessions the answer used — so teams don't have to trust AI outputs blindly.
Designed to answer questions, not to make slides
The dashboards are designed to be read during hiring reviews. The goal is the right call on the right candidate, not a quarterly summary deck.